← Back
Collision Between Front Eagle and Adalynn: Satellite and AIS Analysis
Overview of the incident
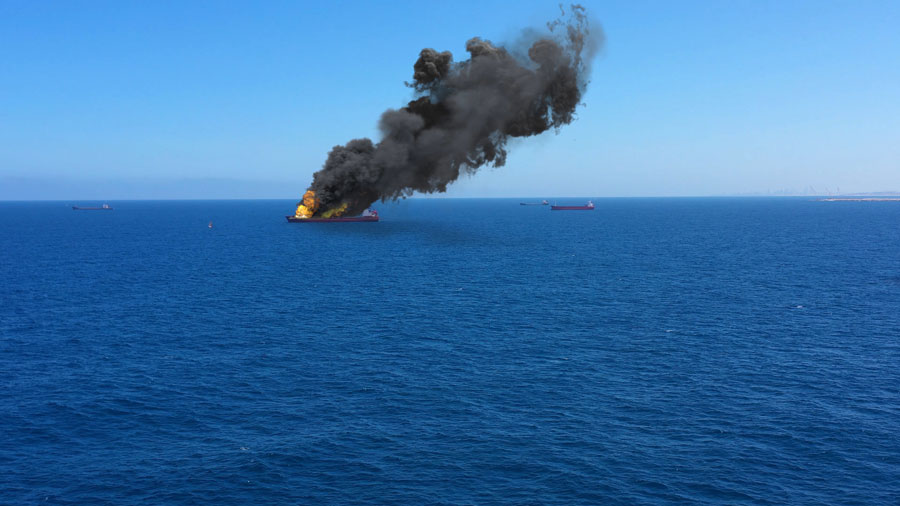
When the Front Eagle and the Adalynn collided near Khawr Fakkan in June 2025, the circumstances surrounding the impact were unclear. A fire broke out on board the Adalynn, causing localized marine pollution.
Even though CLS did not have access to elements such as those held by the Maritime Incident Investigation team (VDR or communication records), CLS demonstrated that the initial assumptions about the vessel responsible for the collision were incorrect through a combined analysis of AIS data, satellite imagery, and ocean drift modelling.
Background and initial assumptions
The Adalynn had previously been listed on both OFAC and UANI sanctions lists for its involvement in oil trades linked to Venezuela and Iran. Following a change of ownership in early 2024, the vessel was removed from these lists and was no longer part of the so-called “dark fleet.”
In ballast at the time of the incident, it had spent several weeks at anchor off Duqm (Sultanate of Oman) before sailing toward a new anchorage near Khawr Fakkan (UAE).
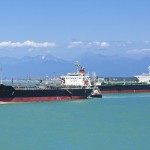
The Front Eagle, meanwhile, had just completed loading approximately two million barrels of crude oil at Iraq’s Al Bakr terminal and was en route to the Strait of Hormuz and the Arabian Sea.
These two trajectories would soon intersect.
Reconstructing the Front Eagle and Adalynn collision using satellite imagery and AIS data
By combining AIS data, Sentinel-2 optical imagery, and VIIRS thermal acquisitions, CLS analysts were able to access a reconstruct of the full sequence of the Front Eagle and Adalynn collision.
Vessel trajectories and convergence
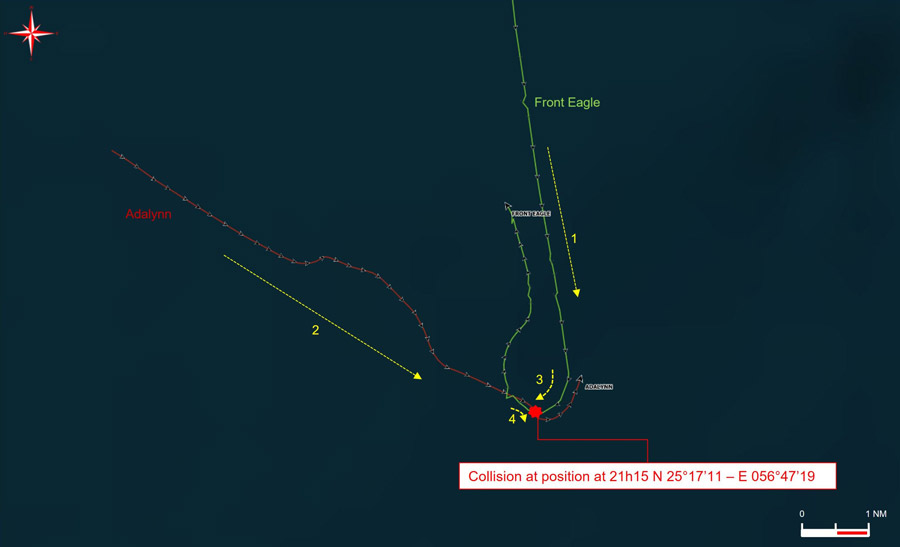
The Front Eagle was sailing southward at a speed of about 13 knots. The Adalynn, heading east at around 5 knots, was moving slowly and steadily.
As the two ships approached, their courses became convergent. To pass away the stern of a third ship, Adalynn conducted a slow manoeuver port and then starboard to recover her initial route. Detecting the Adalynn on radar with a decreasing CPA, analyst assessed that Front Eagle could not reach by radio the Adalynn to clarify her intentions.
The Front Eagle altered its course to starboard without checking visually that the Adalynn was scrolling right and then she was passing ahead, in line with the COLREG navigation rules. Even in night, visibility was reported good that night.
AIS interpretation and radar perception issues
However, due to Adalynn’s low speed and relative position, the radar image on the Front Eagle gave a misleading impression of closing distance due to the radar update rate.
Believing the opposing vessel was on a collision course, the Front Eagle’s master executed an emergency turn to starboard, intending to pass behind the Adalynn.
In reality, this action placed the tanker directly on the smaller vessel’s trajectory.
Satellite imagery confirmation
The impact occurred at 21:15 local time, at position N 25°17’11 – E 056°47’19, striking the Adalynn on her port side.
Subsequent VIIRS imagery from June 17 detected a thermal hotspot corresponding to the fire that broke out on board immediately after the collision.
Through its satellite imagery and AIS analysis of a maritime collision, CLS was able to challenge the initial assumptions made about the vessels involved.
Pollution monitoring and drift modelling
Initial slick observations
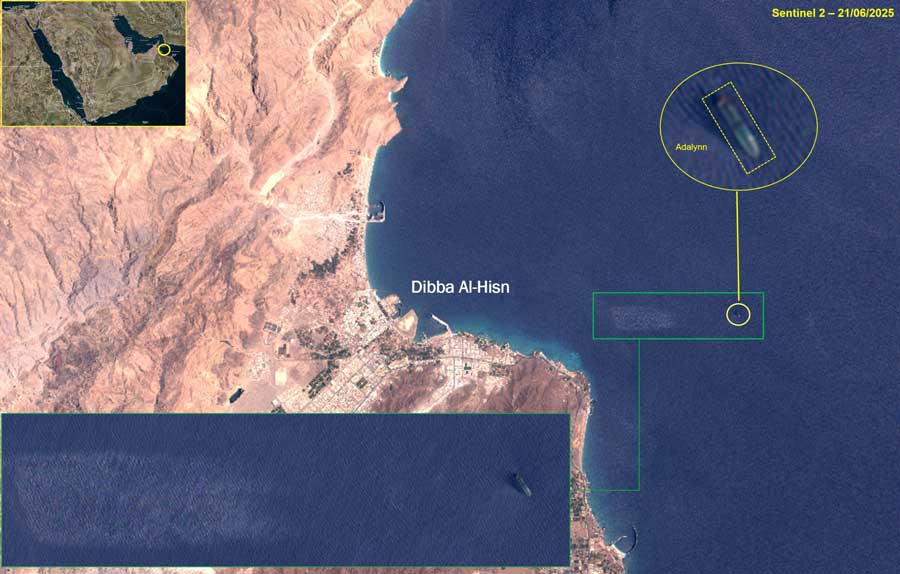
Sentinel-2 imagery from June 21 revealed a large oil slick stretching 32 km, covering an estimated area of 46 km².
However, CLS’s drift modelling demonstrated that this slick, pushed northward by winds of 10–15 knots (NW) and currents of around 0.2 knots (ENE), could not have originated directly from the collision, as its dispersion pattern was inconsistent with the event’s timing.
Drift modelling and environmental assessment
A first slick (10 km²) has been observed around the Adalynn after the collision. CLS could observe later a second smaller slick (≈ 2 km²) after it was towed to the port of Dibba Al-Hisn.
Those localized pollutions may be consistent with firefighting operations and deck wash procedures conducted on board following the fire but only local samples could prove it.
CLS’s multi-source analytical contribution
CLS combined multiple data sources and analytical capabilities to independently and scientifically verify the sequence of events:
- AIS data analysis: detailed tracking of each vessel’s position, speed, and course via the MAS platform.
- Multi-source satellite imagery: Sentinel-2 for optical and color detection, VIIRS for thermal hotspots, and PAZ for pollution mapping.
- Ocean drift modelling: integration of wind and current data to assess the spatial and temporal coherence of observed slicks.
The Front Eagle and Adalynn collision case analysis demonstrates how satellite imagery and AIS analysis of a maritime collision can reveal the true sequence of events.
Enhancing maritime intelligence through satellite and AIS analysis
By merging these complementary datasets, CLS was able to rewrite the event’s timeline, disprove early assumptions, and provide authorities with a comprehensive, time-stamped, and verifiable analysis.
A tangible example of how satellite data and maritime intelligence contribute to safety, accountability, and transparency at sea.